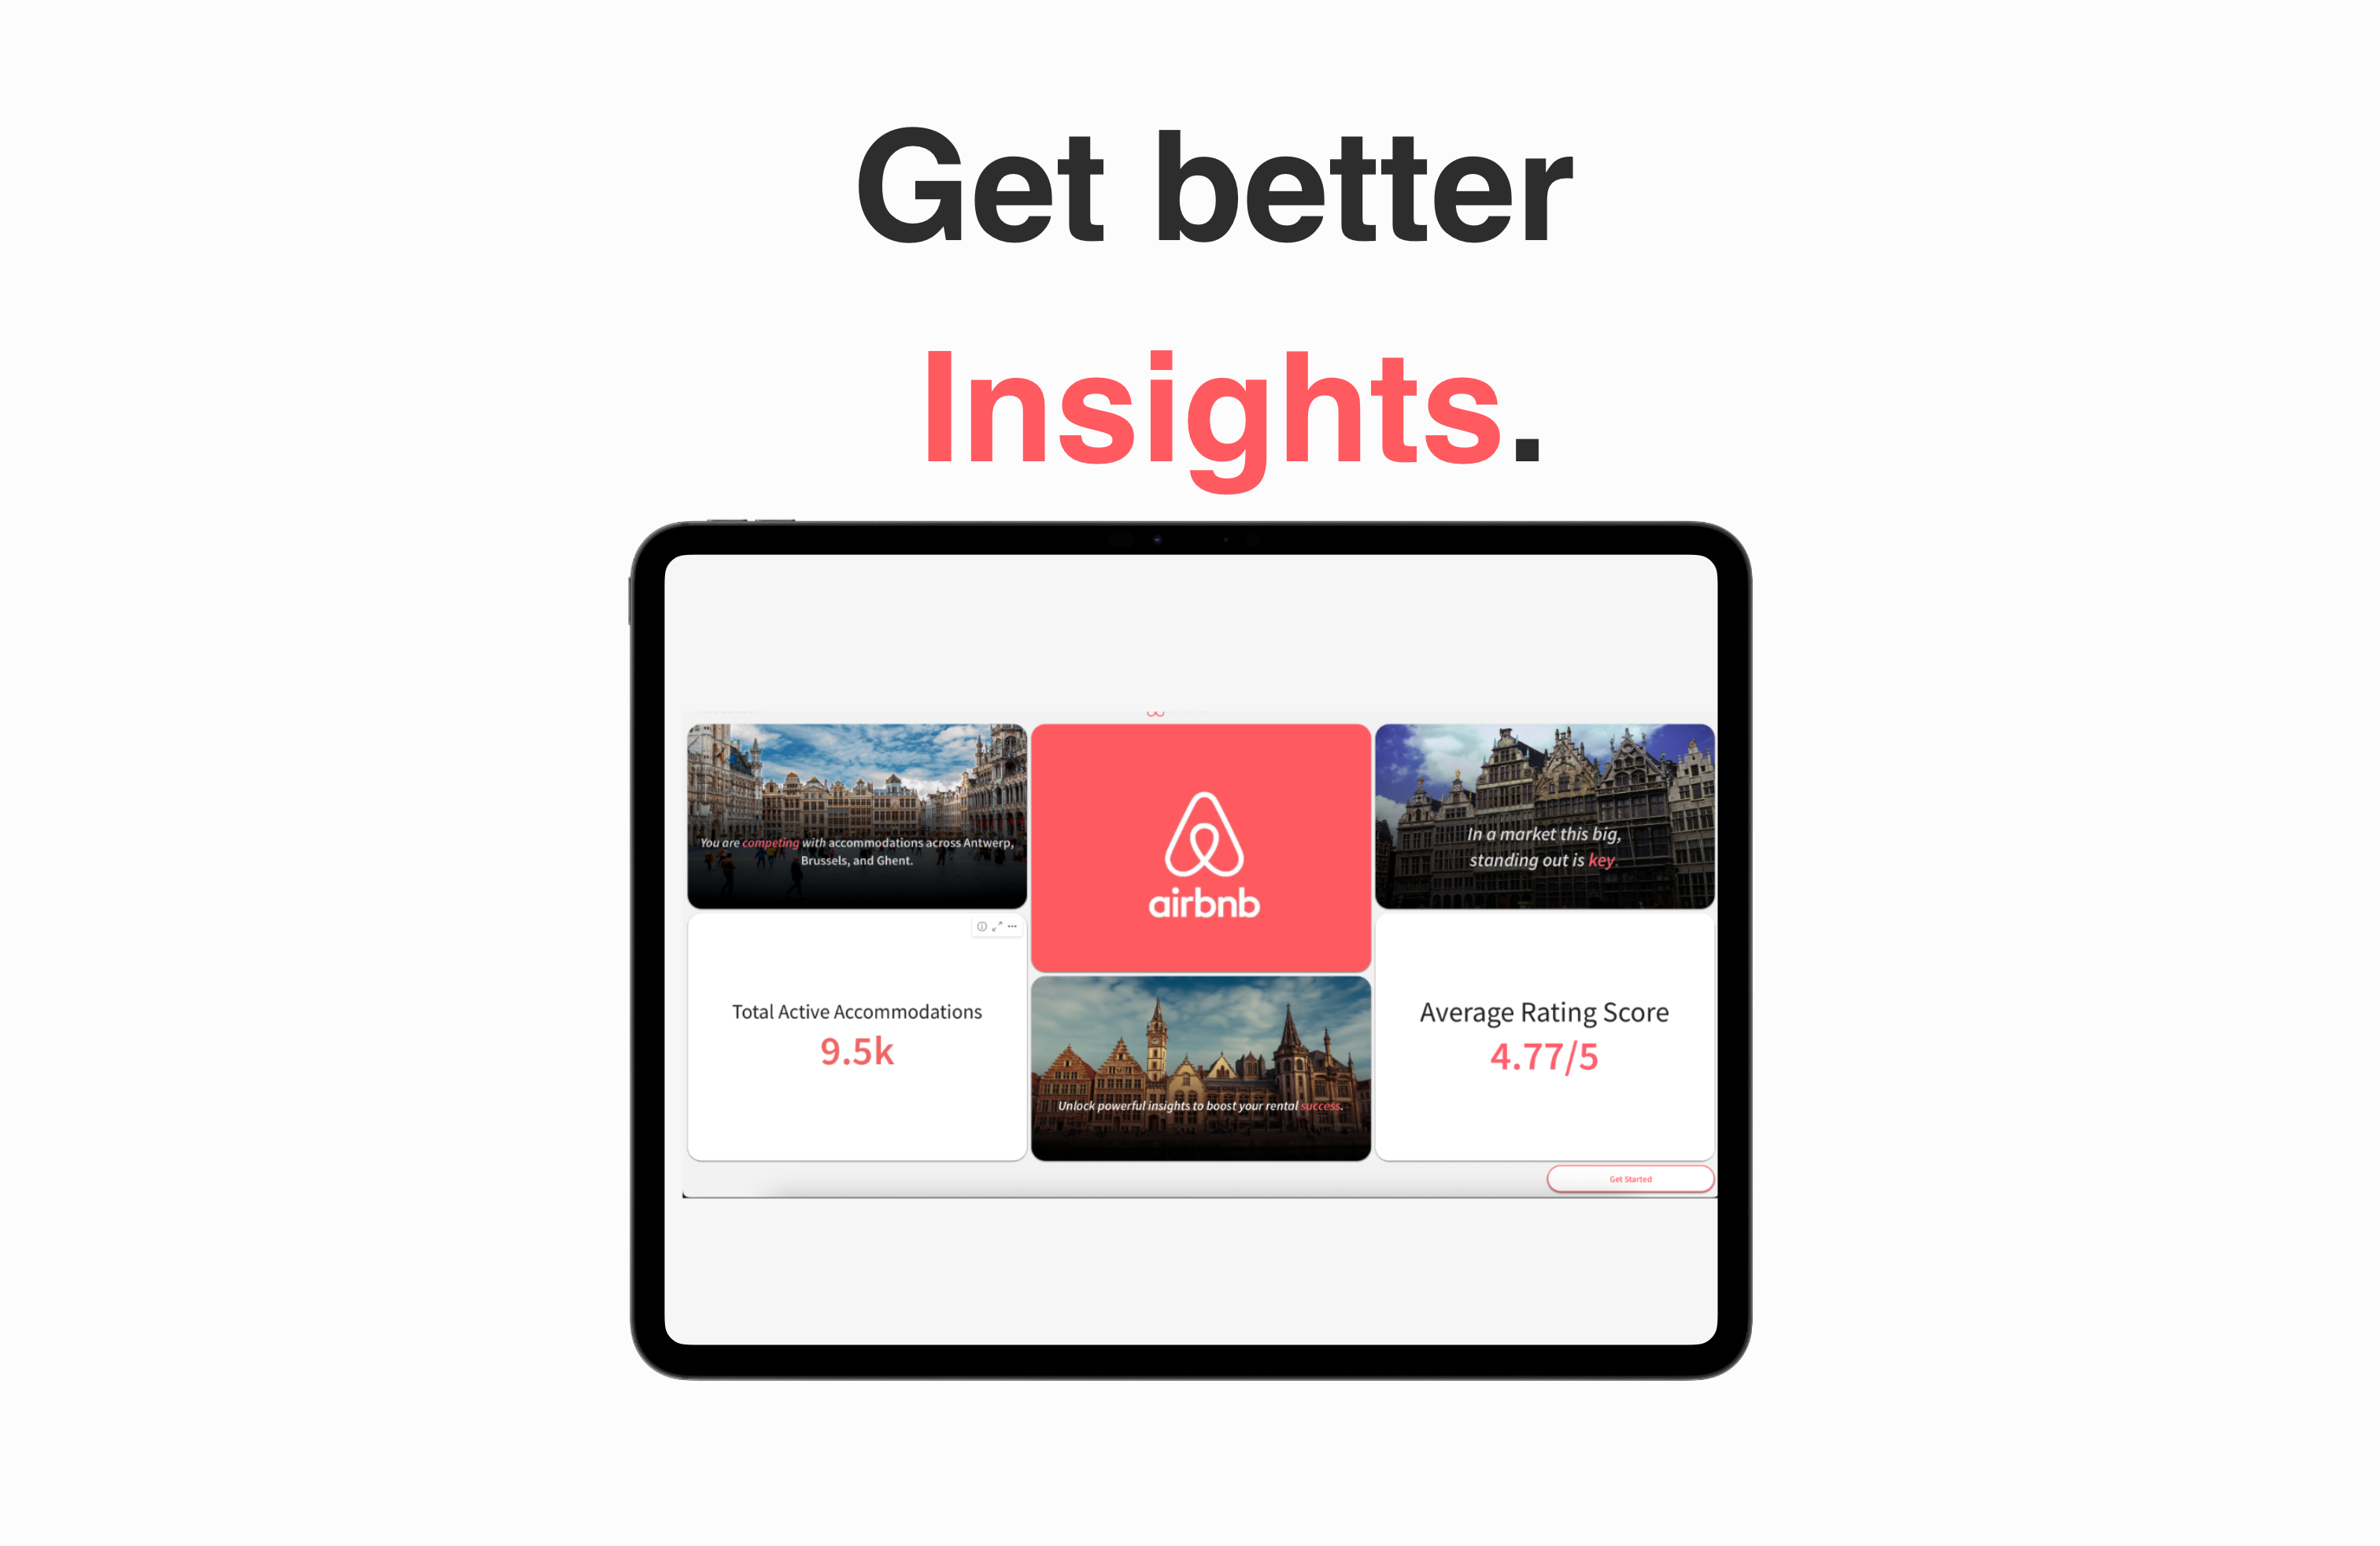
Airbnb Dashboard: Competitive Insights for Hosts
Visualizing 2023-2024 Airbnb data for hosts in Brussels, Ghent, and Antwerp
Explore Qlik SenseProject Overview
The Airbnb Dashboard is a Qlik Sense data visualization platform I developed to empower Airbnb hosts in Brussels, Ghent, and Antwerp with actionable insights. Using Airbnb data from 2023-2024, the dashboard provides a centralized interface for hosts to analyze market trends, pricing strategies, and competitor performance, enabling them to optimize their listings and improve occupancy rates.
The project addressed the challenge of fragmented market information, which made it difficult for hosts to understand their competitive landscape. The dashboard includes visualizations such as pricing distributions, occupancy rates, guest review trends, and geographic demand patterns. Designed with a user-friendly interface, it allows hosts to filter data by city, property type, or time period, offering tailored insights to inform strategic decisions like dynamic pricing or property enhancements.
Skills and Technologies
My Contributions
For the Airbnb Dashboard, I handled data preprocessing, dashboard design, and visualization development using Qlik Sense. I cleaned and structured the 2023-2024 Airbnb dataset, ensuring data integrity for accurate visualizations. I created interactive charts, including bar graphs, heatmaps, and trend lines, to highlight key metrics like average nightly rates, booking trends, and guest satisfaction scores across Brussels, Ghent, and Antwerp.
I identified key performance indicators (KPIs) relevant to hosts’ needs, such as competitive pricing and demand forecasting. Using Qlik Sense’s associative engine, I implemented dynamic filters to allow hosts to explore data by location, date range, or property attributes. I focused on creating an intuitive interface, ensuring hosts could easily navigate and derive insights to inform their strategies.
This project enhanced my skills in data analysis, UI/UX design for dashboards, and business intelligence. By iterating based on my own testing and feedback, I refined the dashboard to deliver a user-friendly and insightful tool that helps Airbnb hosts make data-driven decisions in a competitive market.
Technologies Used
Project Gallery
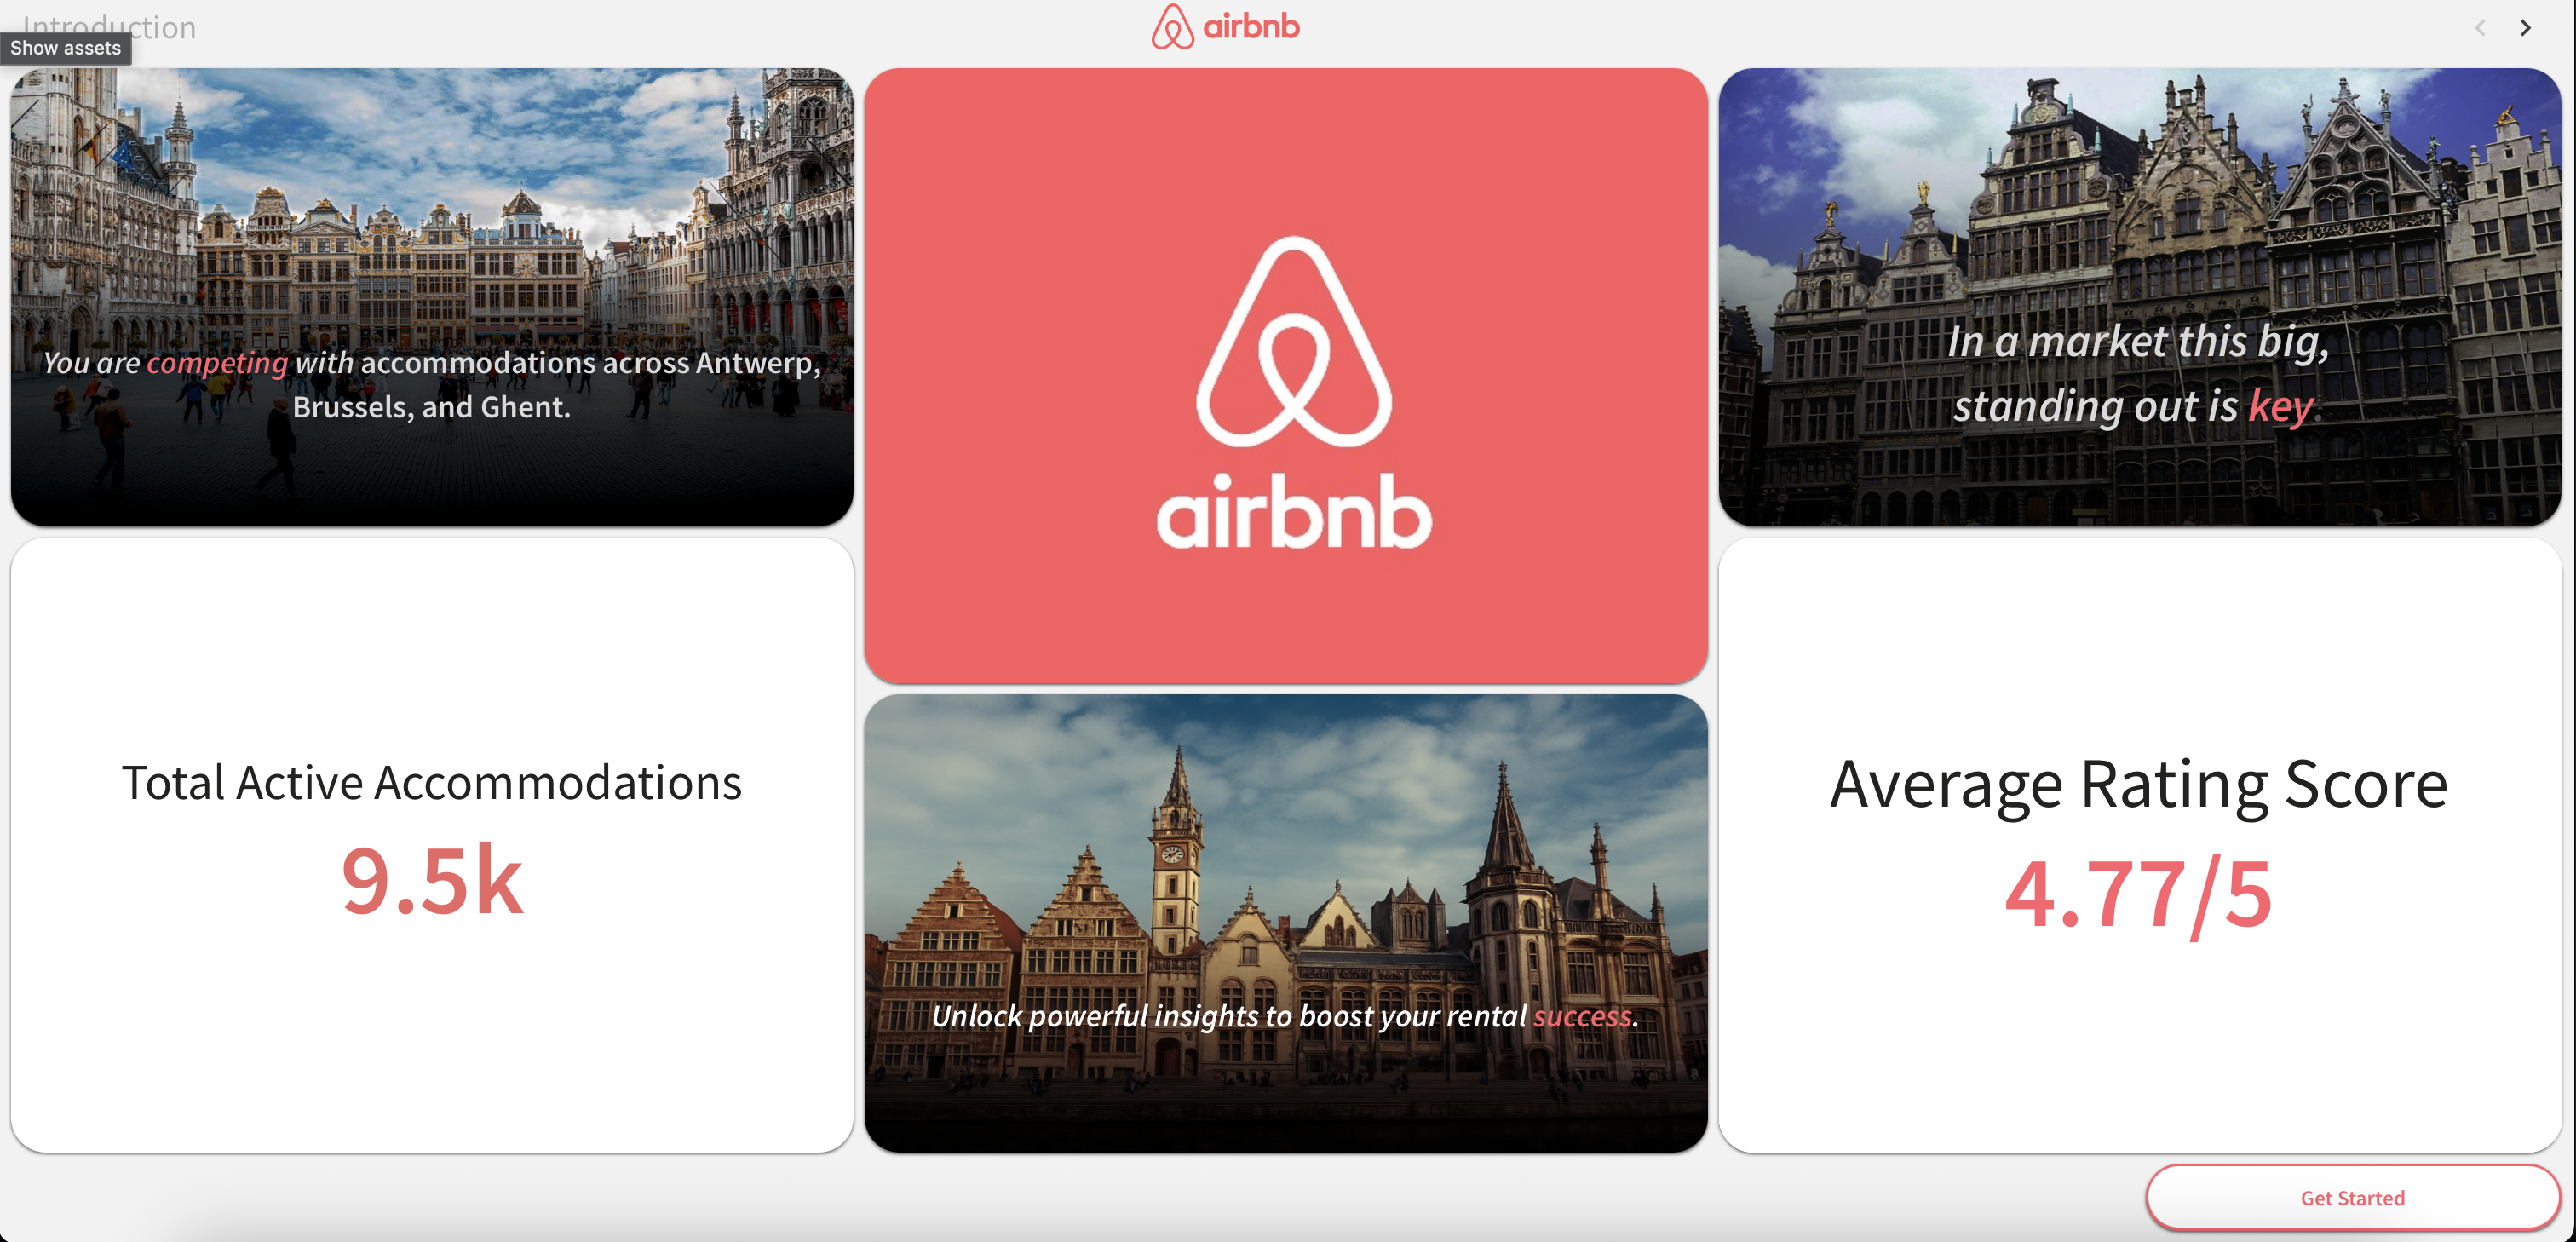
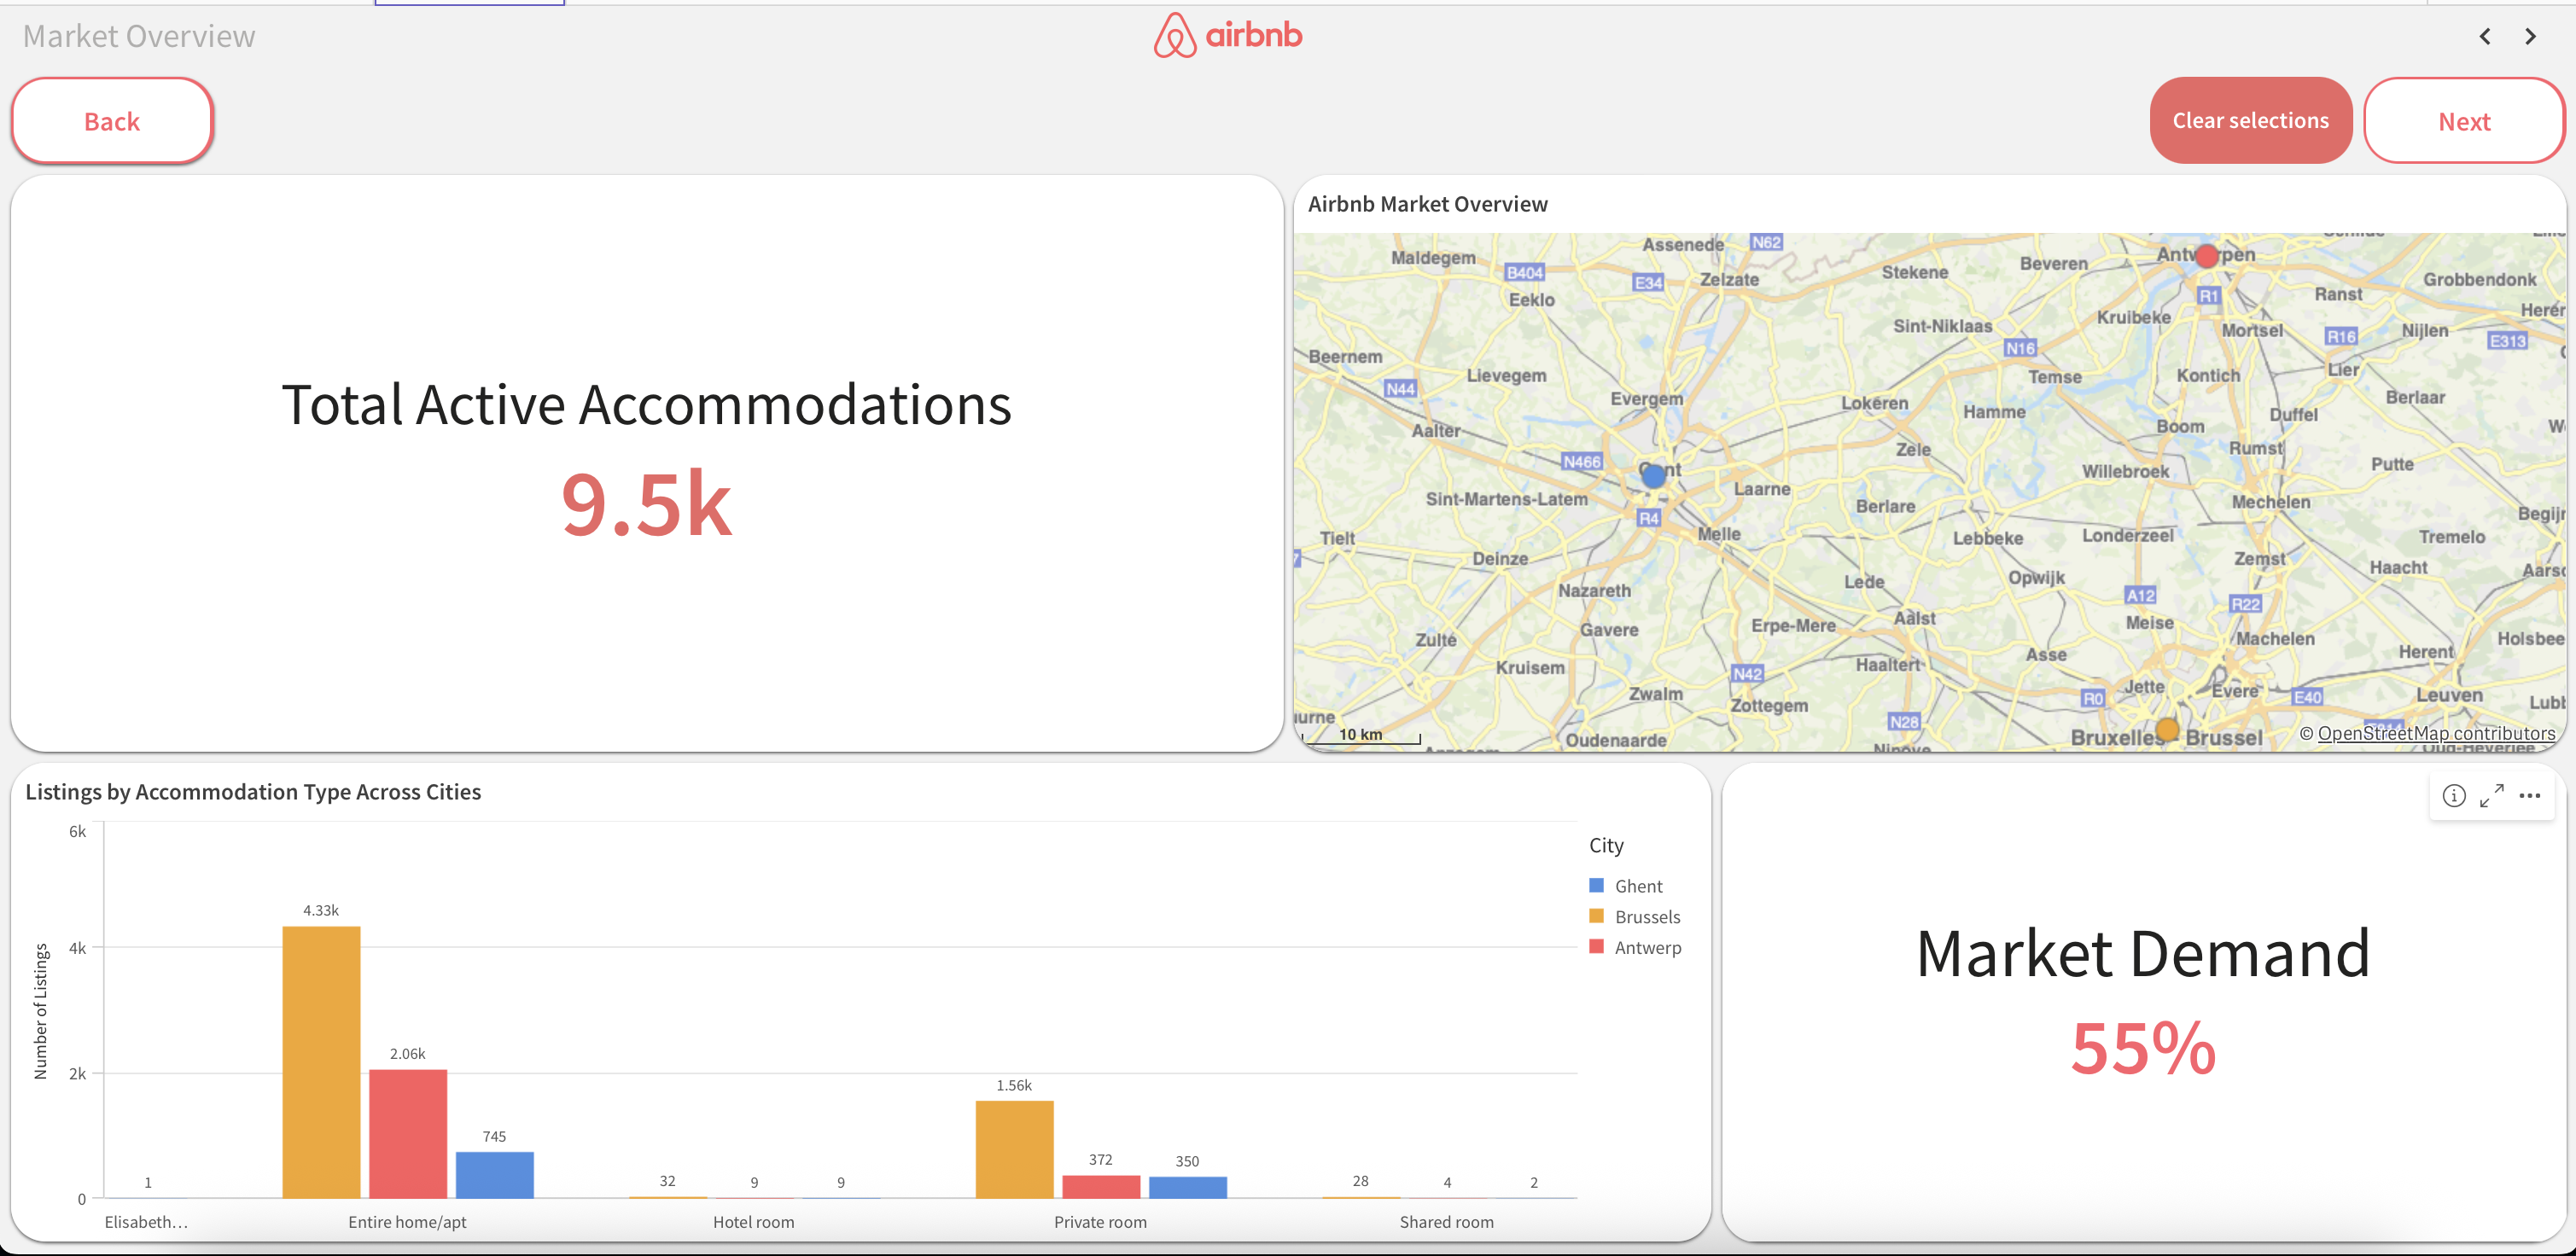
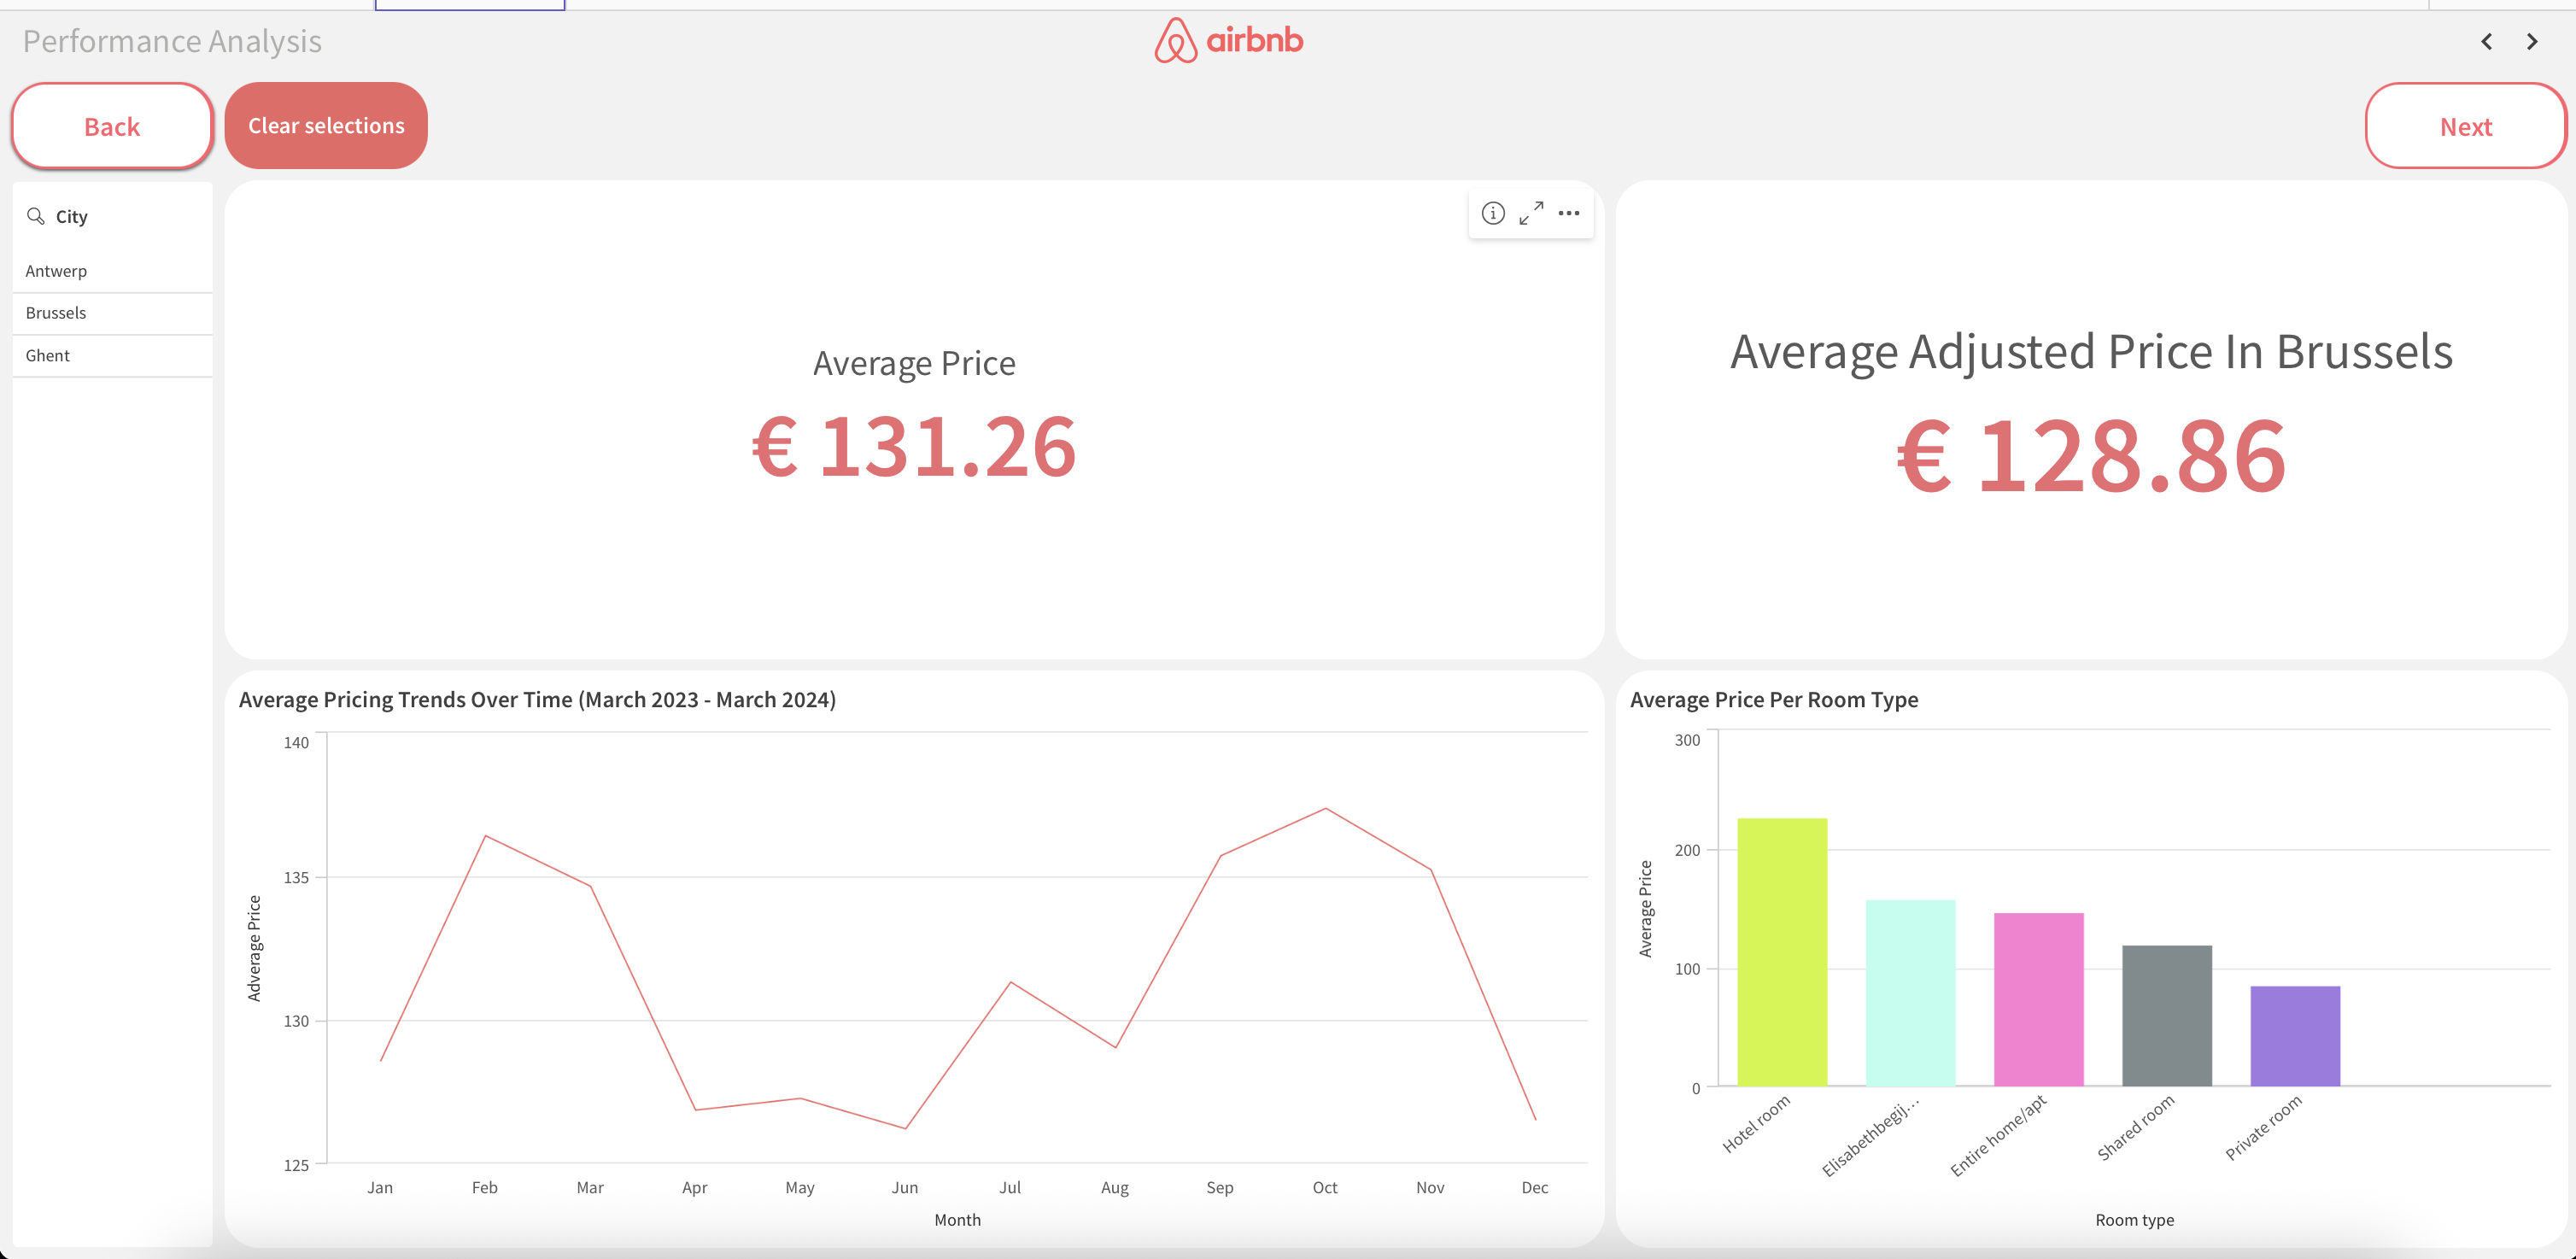
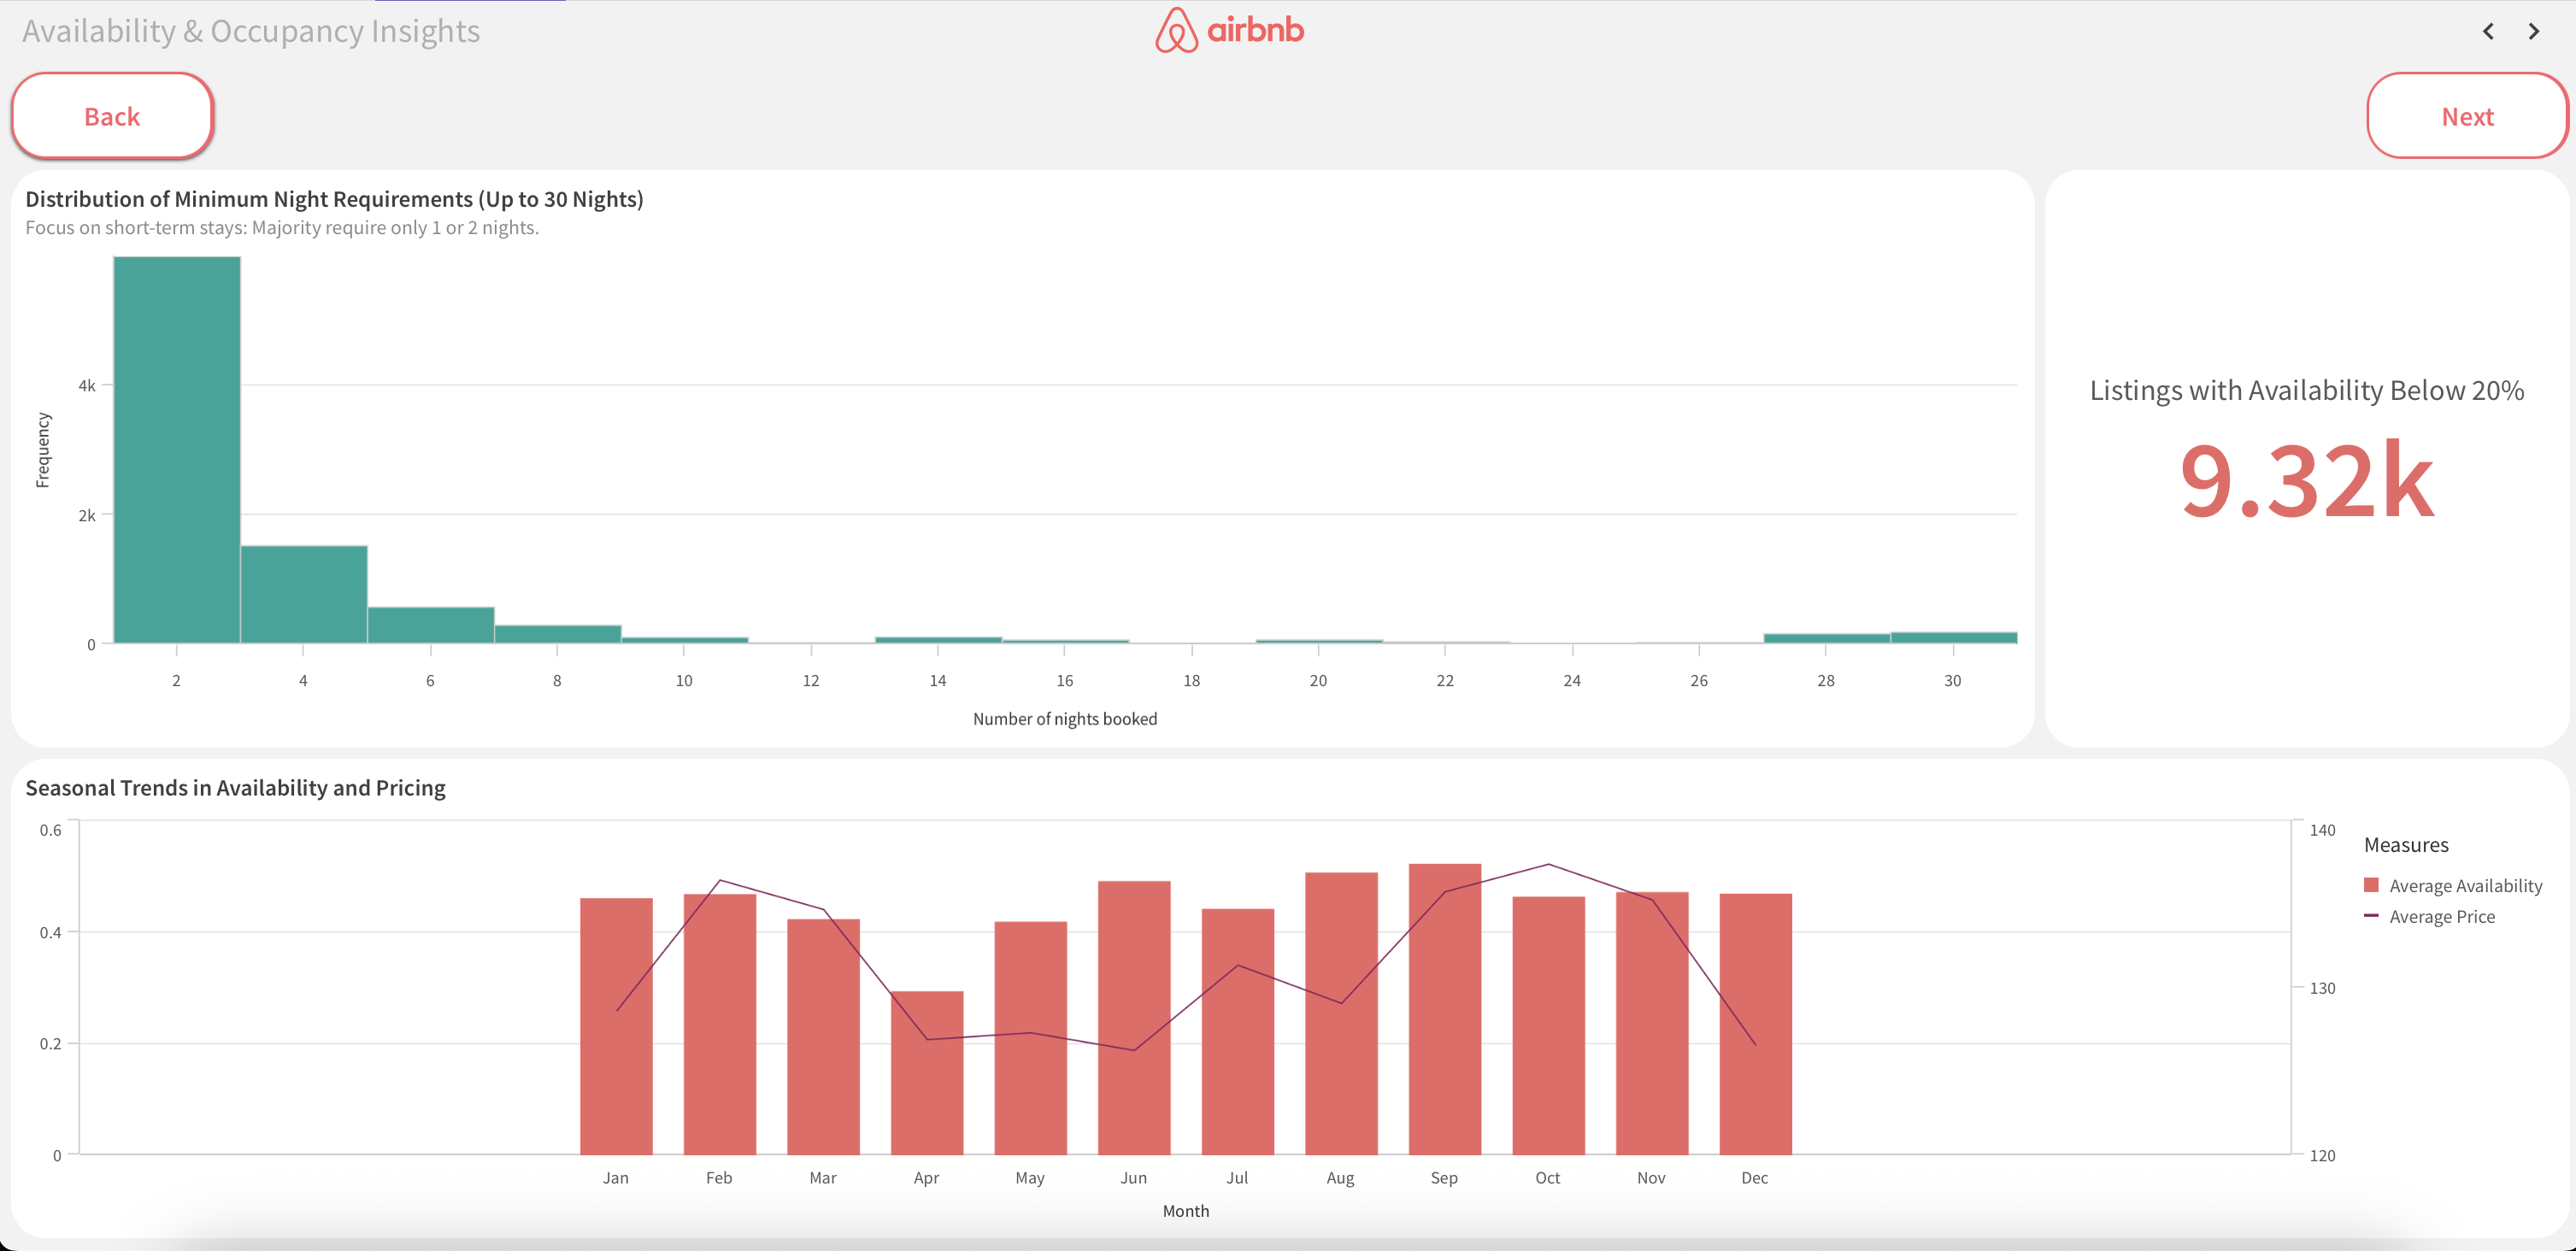
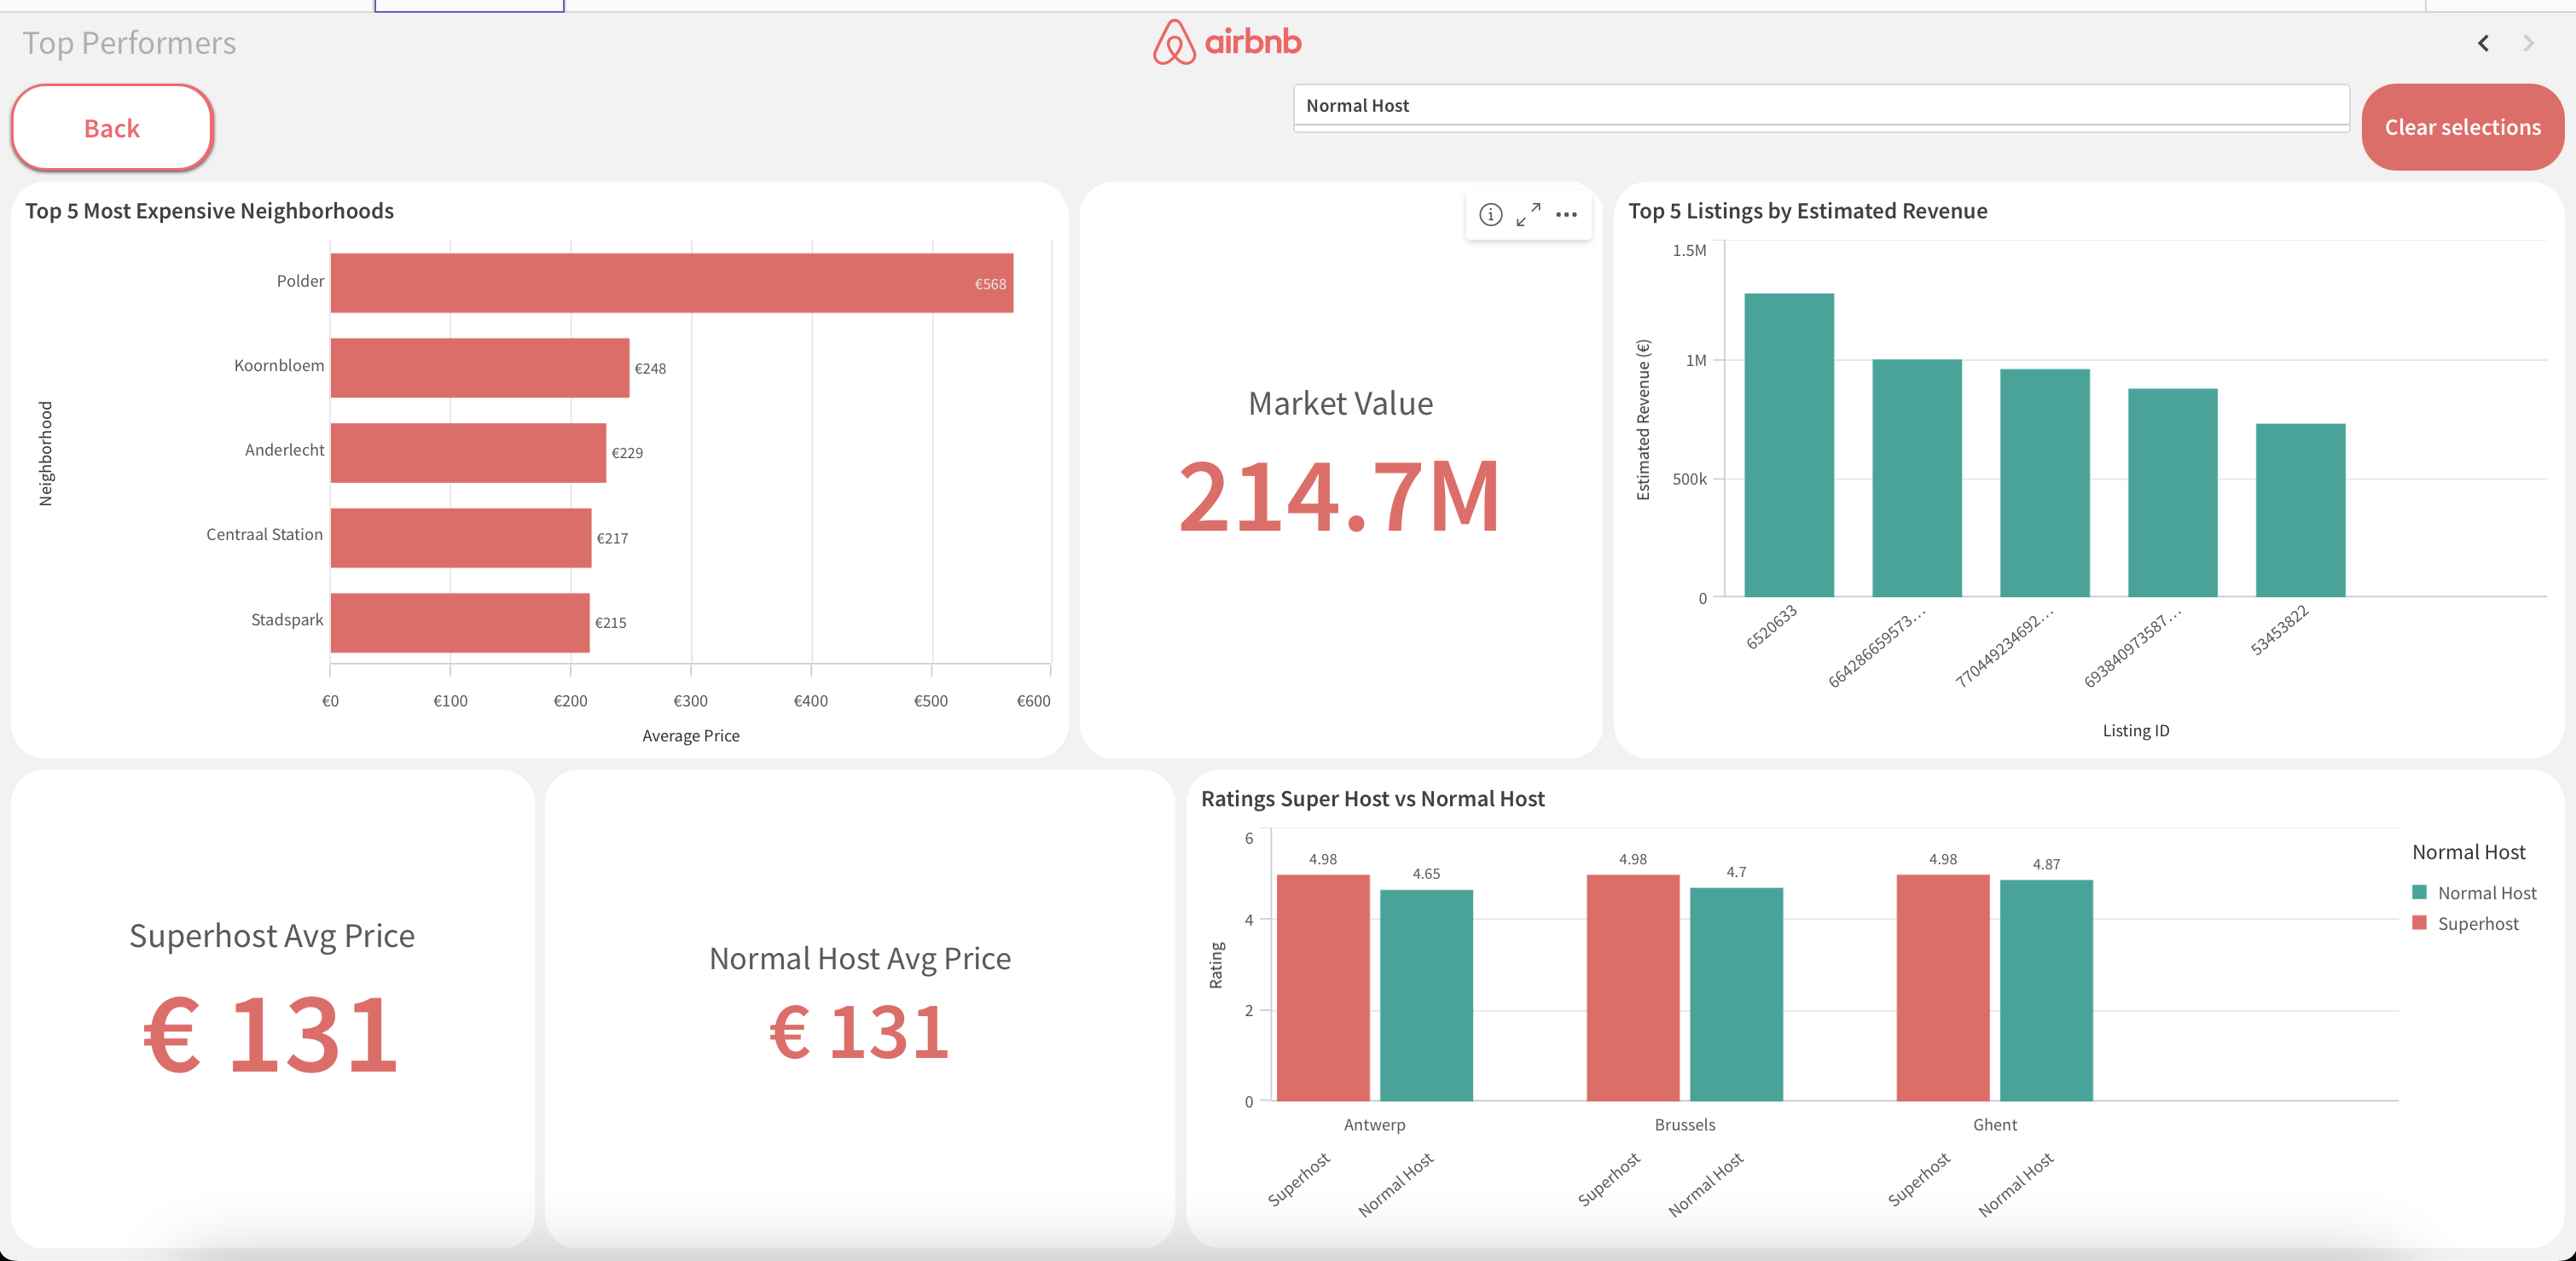
Screenshots showcasing the Airbnb Dashboard’s visualizations and interface. Hover and click to view larger images.
Explore More Projects
View all projectsInterested in Collaborating?
Let's work together on innovative projects that make an impact.